By Sarah Larsen
As an undergraduate, Jesse Way started to get curious about nitrogen availability from cover crops — from a perspective that might strike a chord with his farming family and neighbours back home.
Instead of tackling these questions by entering a graduate program, Jesse chose to return to his family’s farm. In 2018, he and his partner, Meghan Brandenburg, along with Jesse’s father, downsized and relocated to a smaller farmstead. Milky Way Farm a 1.5 mixed vegetable, 4 season, ecologically focused family farm located just South of Woodstock, Ontario, whose clever name pays homage to six generations of dairy farming in Jesse’s family.
Nearly a decade later, Jesse and Meghan are feeling established, and have decided to bring research to the farm to answer some of those nagging questions about nitrogen availability from cover crops.
“We’ve always used cover crops because, from an academic perspective, we know about their soil health benefits and that they contribute to nitrogen availability,” explains Jesse. “But we didn’t have a good way of quantifying the nitrogen contribution from the array of cover crops we use.”
So when Jesse and Meghan read a Research Bulletin by Dan Sullivan, published by Oregon State University (OSU; 1), about on-farm methods for estimating plant available nitrogen (PAN) from cover crops, they were inspired to test these methods on their farm.

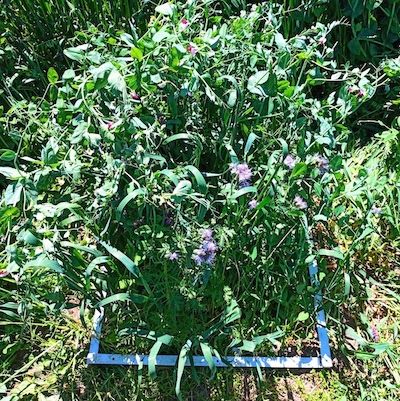
A view of the trial beds at Milky Way Farm.
In Oregon, researchers developed a PAN prediction calculator that is available for free through the OSU website (2). It uses the wet weight of a cover crop biomass sample, along with per cent dry matter and per cent nitrogen from lab analysis, as inputs for estimating PAN.
With the OSU studies as a template, Jesse and Meghan received funding from EFAO’s Farmer-Led Research Program to run a randomized and replicated trial. Across four replicates, they compared high- and low-legume spring cover crop mixes to controls without cover crops and measured the PAN and soil nitrate available for their fall carrots.
On the choice of cash crop, Jesse notes they chose carrots because carrots “fit into our crop rotation in terms of the number of beds available and that we were already planning to use a spring cover crop ahead of them.” And, since they were still relying on the crop for market, it felt less risky to rely solely on nitrogen from cover crops and soil mineralization for carrots instead of a heavy feeding crop.
What they found from the data was exciting. “We knew our soil was cycling some nitrogen, but this trial showed us that our soil is cycling a larger amount of nitrogen than we had expected!” exclaims Jesse.
Also exciting, was information on the seasonal changes in nitrogen availability as a result of altering the legume content in their cover crop mixes which included hairy vetch and peas.
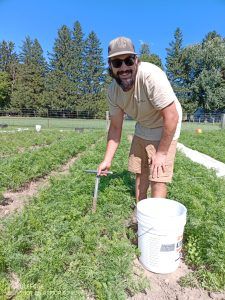
Jesse taking soil samples for soil nitrate analysis at Milky Way Farm.
Soil nitrate values at termination showed that the cover crops acted as an effective catch crop by reducing soil nitrate early in the season. At the time of cover crop termination average soil nitrate without cover crops was 19 ppm versus soil nitrate in beds with cover crops ranged from 2-4 ppm.
As the season progressed and the carrots started to grow, Jesse and Meghan saw PAN estimates and soil nitrate values increase in the cover crop beds, especially from the high-legume cover crop. This result gives them confidence, says Jesse, to “lower the legume content — and therefore seed cost — of their cover crops for carrots and other light-feeding crops”.
While it was reassuring to see data showing that the cover crop acts as a catch crop, they were even more encouraged by the applicability of both the pre-plant and mid-season soil nitrate tests for informing cash crop nitrogen requirements, when the results were compared to the research from the OSU team (3).
Overall, Jesse and Meghan were pleased to see that carrot yield from the cover crop beds were within their target yields of 175-200 lbs per 200ft2 bed, weighing in at an average of 181 lbs per bed from the high-legume cover crop beds and 185 lbs per bed from the low-legume cover crop beds. The control beds yielded an average of 168 lbs per bed, which was statistically similar to the cover crop beds.
They were also pleased to see that the PAN estimates from the cover crop biomass measurements, and soil nitrate testing “backed each other up, and proved useful.” Jesse feels this trial shows that these measurement tools are “promising for testing in different scenarios in the future.”
Admittedly, taking the biomass samples and having to interpret the results for the first time this year was “a little daunting because doing something for the first time you might think it is more challenging than it really is”, reflects Jesse. Nonetheless, they encourage other farmers to take biomass samples because it is a relatively easy way to estimate PAN through the growing season.
“Sending a sample in for per cent moisture and per cent nitrogen is around $40 for so much valuable information”, says Jesse. “And if you do that for a few years you can create your own farm-specific database so you can use fresh (wet) weights and don’t need to rely on lab analyses (indefinitely).”
This year Jesse will continue the trial looking at the effect of tillage and planting date on a cover crop of overwintered rye and vetch. He will also continue to send in cover crop biomass samples for different cover crops to populate his farm-specific database — and sees potential for other farms to do the same to generate regional-specific databases that can inform a broader community of ecological farmers.
“This trial provides more evidence of the value of cover crops, and helps demonstrate the use of cost-effective tools available to farmers to quantify PAN from cover crops so we can better account for nitrogen in our systems.”
References
1. Sullivan et al., 2020. Estimating Plant- Available Nitrogen Release from Cover Crops. Oregon State University Extension Service.
2. Sullivan et al. 2019. OSU Organic Fertilizer & Cover Crop Calculator: Predicting Plant-available Nitrogen. Oregon State University Extension Service.
3. Sullivan et al., 2019. Soil Nitrate Testing for Willamette Valley Vegetable production. Oregon State University Extension Service.
—
Sarah Larsen is EFAO’s Research & Small Grains Program Director and also supports soil health components of EFAO’s education programs. She holds a Ph.D. in Soil Microbial Ecology from Iowa State University, and along with her partner and their daughter, tends the land that they call Three Ridges Ecological Farm near Aylmer, Ontario.